Playlist placements play a key role in music discovery, but understanding which playlists truly impact performance isn't always straightforward.
Playlist Analytics in Revelator Pro gives you a clear, structured view of how your catalog performs across playlists on major DSPs. From high-level trends to detailed playlist tables and movement tracking, you can see where your music is gaining traction, where it's losing momentum, and how playlists contribute to overall streams.
This guide walks you through each part of Playlist Analytics and explains how to use the data effectively.
1. Supported DSPs
Playlist Analytics currently supports playlist data from:
- Spotify
- Apple Music
- Deezer
Additional DSP coverage will be added in future updates.
2. Where to find Playlist Analytics
Playlist Analytics is available in Analytics → Playlist.
You can also access it at multiple levels of your catalog:
- Parent account
- Label
- Artist
- Release
- Track
3. Playlist dashboard overview
When you first open Playlist Analytics, you'll land on the Playlist Dashboard. This view provides a snapshot of how playlists are contributing to discovery and listening over the selected time period.

Key metrics include:
- Playlist Streams — The total number of streams generated by your tracks when played from any playlist.
- Number of Playlists — The total number of unique playlists featuring tracks from your catalog during the selected period.
- Playlist Followers — The combined follower count of playlists that include your tracks. Follower data availability depends on the DSP. Some platforms may not provide follower information.
- Tracks in Playlists — The number of unique tracks from your catalog that appeared in playlists during the selected period.
The trend graph shows how playlist streams change over time, helping you spot spikes, drops, or sustained growth.
4. Top playlists and discovery signals
Below the main KPIs, you'll see highlights that surface discovery signals at a glance:
- Top Playlists by Streams — Shows the playlists driving the most streams for your catalog.
- Playlist Streams by DSP — Breaks down playlist-driven streams by platform.
- Playlist Streams by Type — Shows how streams are distributed across playlist types, such as editorial, algorithmic, and user-created playlists.
- Playlist Streams by Market — Highlights which countries are generating the most playlist streams.
This section helps you quickly understand where discovery is happening and what kind of playlists are contributing most.
5. All playlists view
Select View All Playlists to open the All Playlists table. This is your most detailed view of playlist performance.
Here, each row represents a playlist that features your catalog.
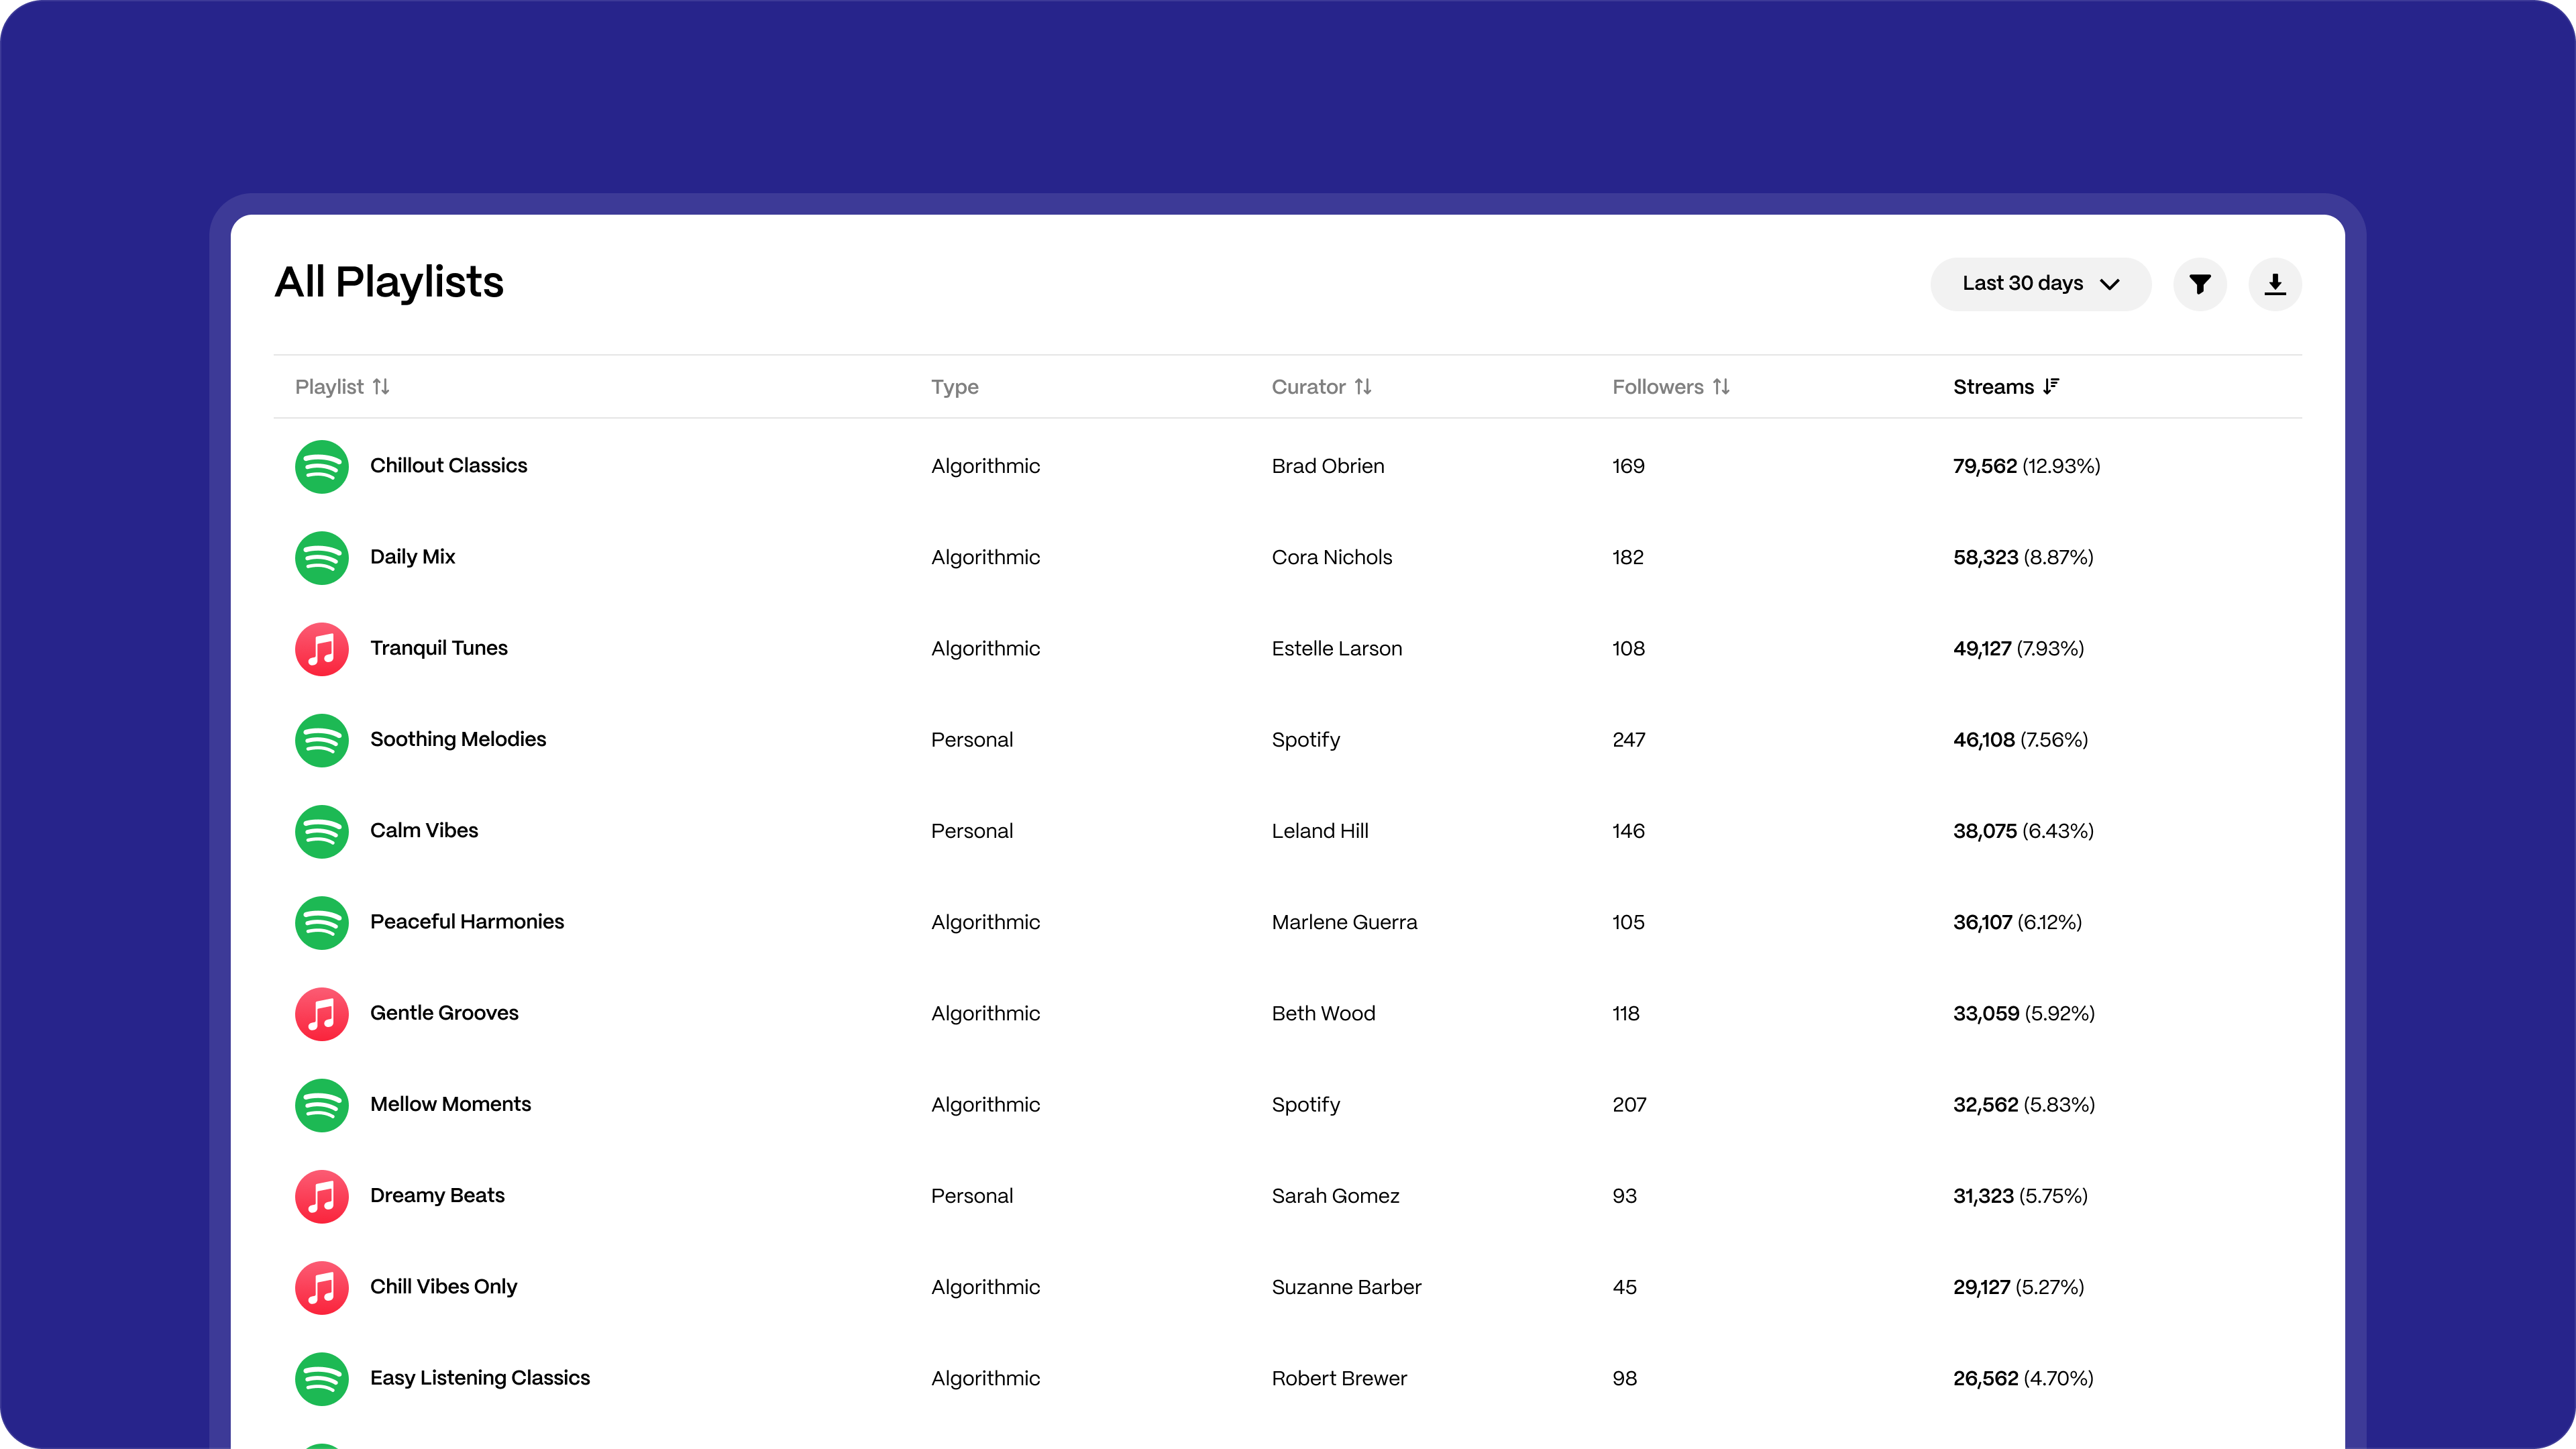
Columns include:
- Playlist name
- DSP
- Playlist type (editorial, algorithmic, personal, etc.)
- Curator (when available)
- Followers (when provided by the DSP)
- Streams generated from that playlist
- Share of total playlist streams
What you can do in this view:
- Sort playlists by streams or followers
- Filter by DSP, market, label, artist, release, or track
- Filter by playlist type
- Export up to 1,000 rows of playlist data as a CSV
This view is ideal for identifying which playlists consistently deliver value and which ones contribute less than expected.
6. Playlist movements
Playlist Movements help you understand how tracks are changing position across playlists over time.

This section includes three tabs:
Active tracks
Tracks that are currently featured in playlists, showing:
- Playlist name and type
- Current position
- Playlist size
- Position movement
- Streams generated
- Days on playlist
Recently added
Tracks that were added to playlists during the selected period, helping you spot new discovery moments early.
Recently removed
Tracks that were removed from playlists, allowing you to identify potential drops in momentum.
Playlist Movements are especially useful for monitoring campaign impact, editorial traction, and early warning signs when tracks begin to lose placement.
7. Filters, time ranges, and exporting data
Across Playlist Analytics, you can refine results using filters such as:
- DSP
- Market
- Label
- Artist
- Release
- Track
- Playlist type
You can also adjust the date range to analyse short-term changes or longer-term trends.
All tables support CSV exports (up to 1,000 rows), making it easy to share insights internally or with partners.
FAQ
What counts as a playlist stream?
A playlist stream is counted whenever a track from your catalog is played from any playlist, across supported DSPs.
Are editorial and user playlists included?
Yes. Playlist Analytics includes editorial, algorithmic, and user-created playlists. You can filter by playlist type in the All Playlists view.
Why don't I see follower data for some playlists?
Follower data depends on what each DSP provides. If a platform does not supply follower information, that column may appear empty.
Can I see playlist data at the artist or track level?
Yes. Playlist Analytics is available at the parent, label, artist, release, and track levels.
How often is playlist data updated?
Playlist Analytics data is refreshed daily, in line with DSP reporting schedules.
Can I export playlist data?
Yes. All playlist tables can be exported as CSV files with up to 1,000 rows.
Was this article helpful?
That’s Great!
Thank you for your feedback
Sorry! We couldn't be helpful
Thank you for your feedback
Feedback sent
We appreciate your effort and will try to fix the article