Where to find it
Go to Analytics → Consumption. The same left-hand sub-navigation gives you access to Engagement, Playlists, Revenue, Top Movers, and Geo dashboards as well.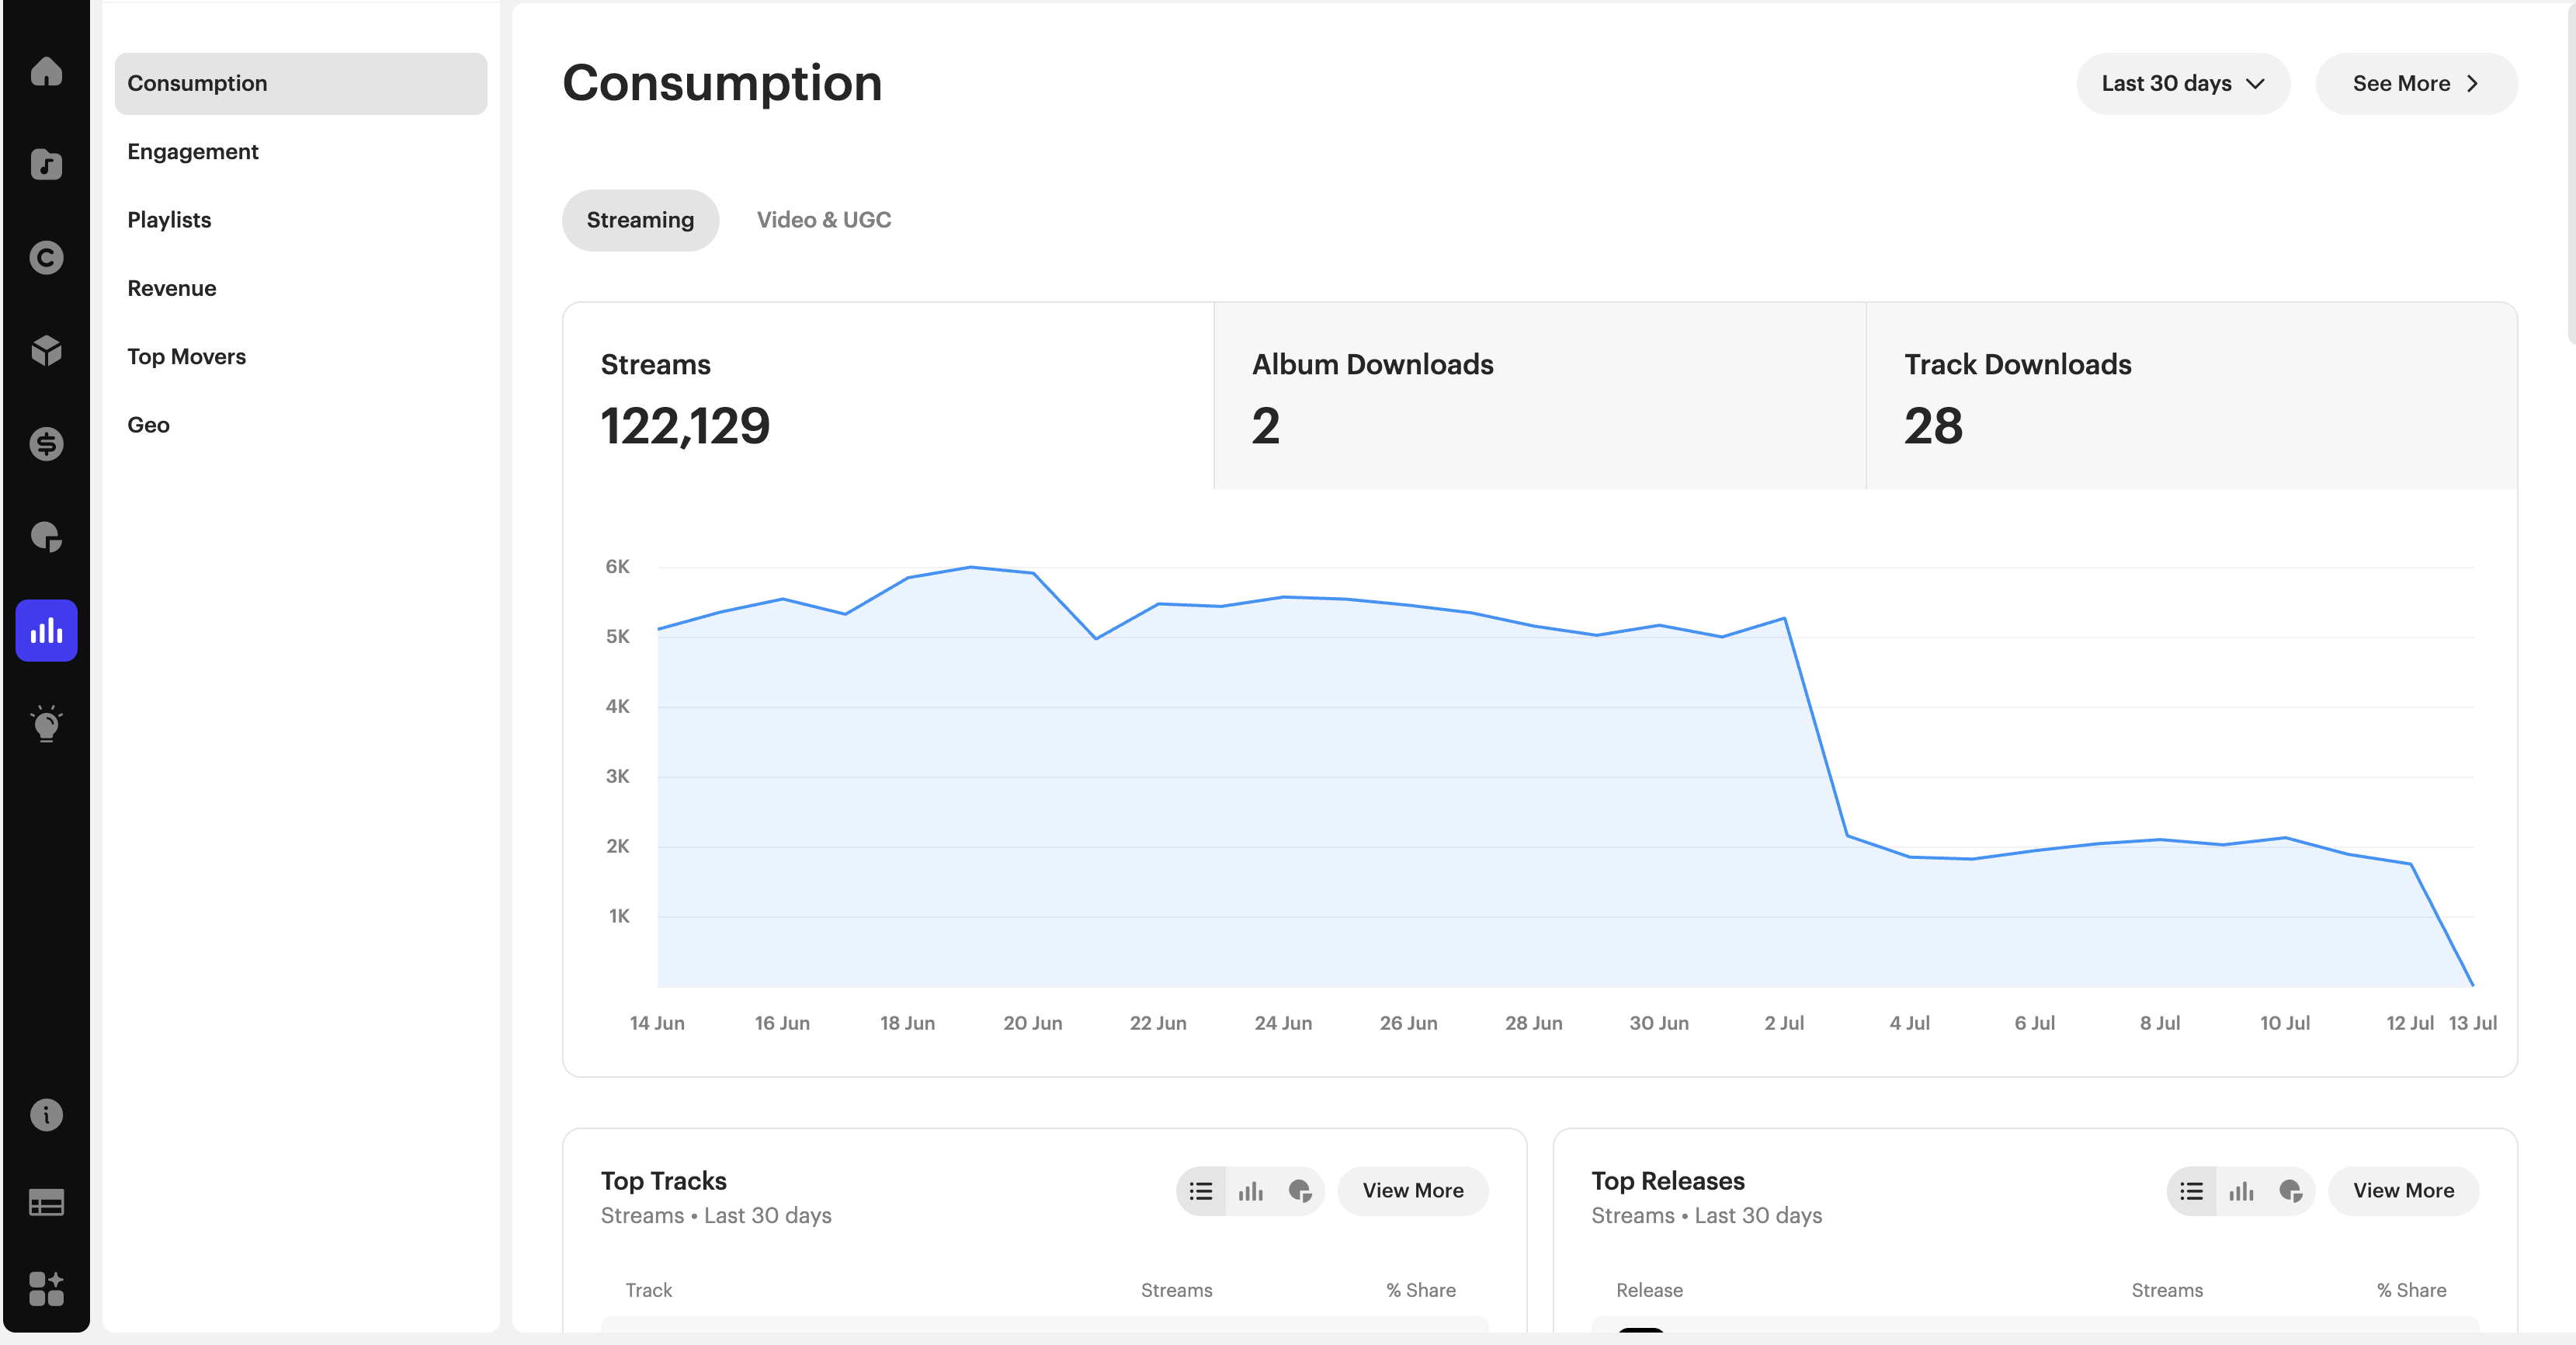
The two tabs: Streaming vs. Video & UGC
- Streaming covers Amazon, Apple, Deezer, SoundCloud, and Spotify.
- Video & UGC covers Instagram, Facebook, YouTube, TikTok, and VEVO. TikTok is excluded from the default view to preserve chart legibility, but you can toggle it on.
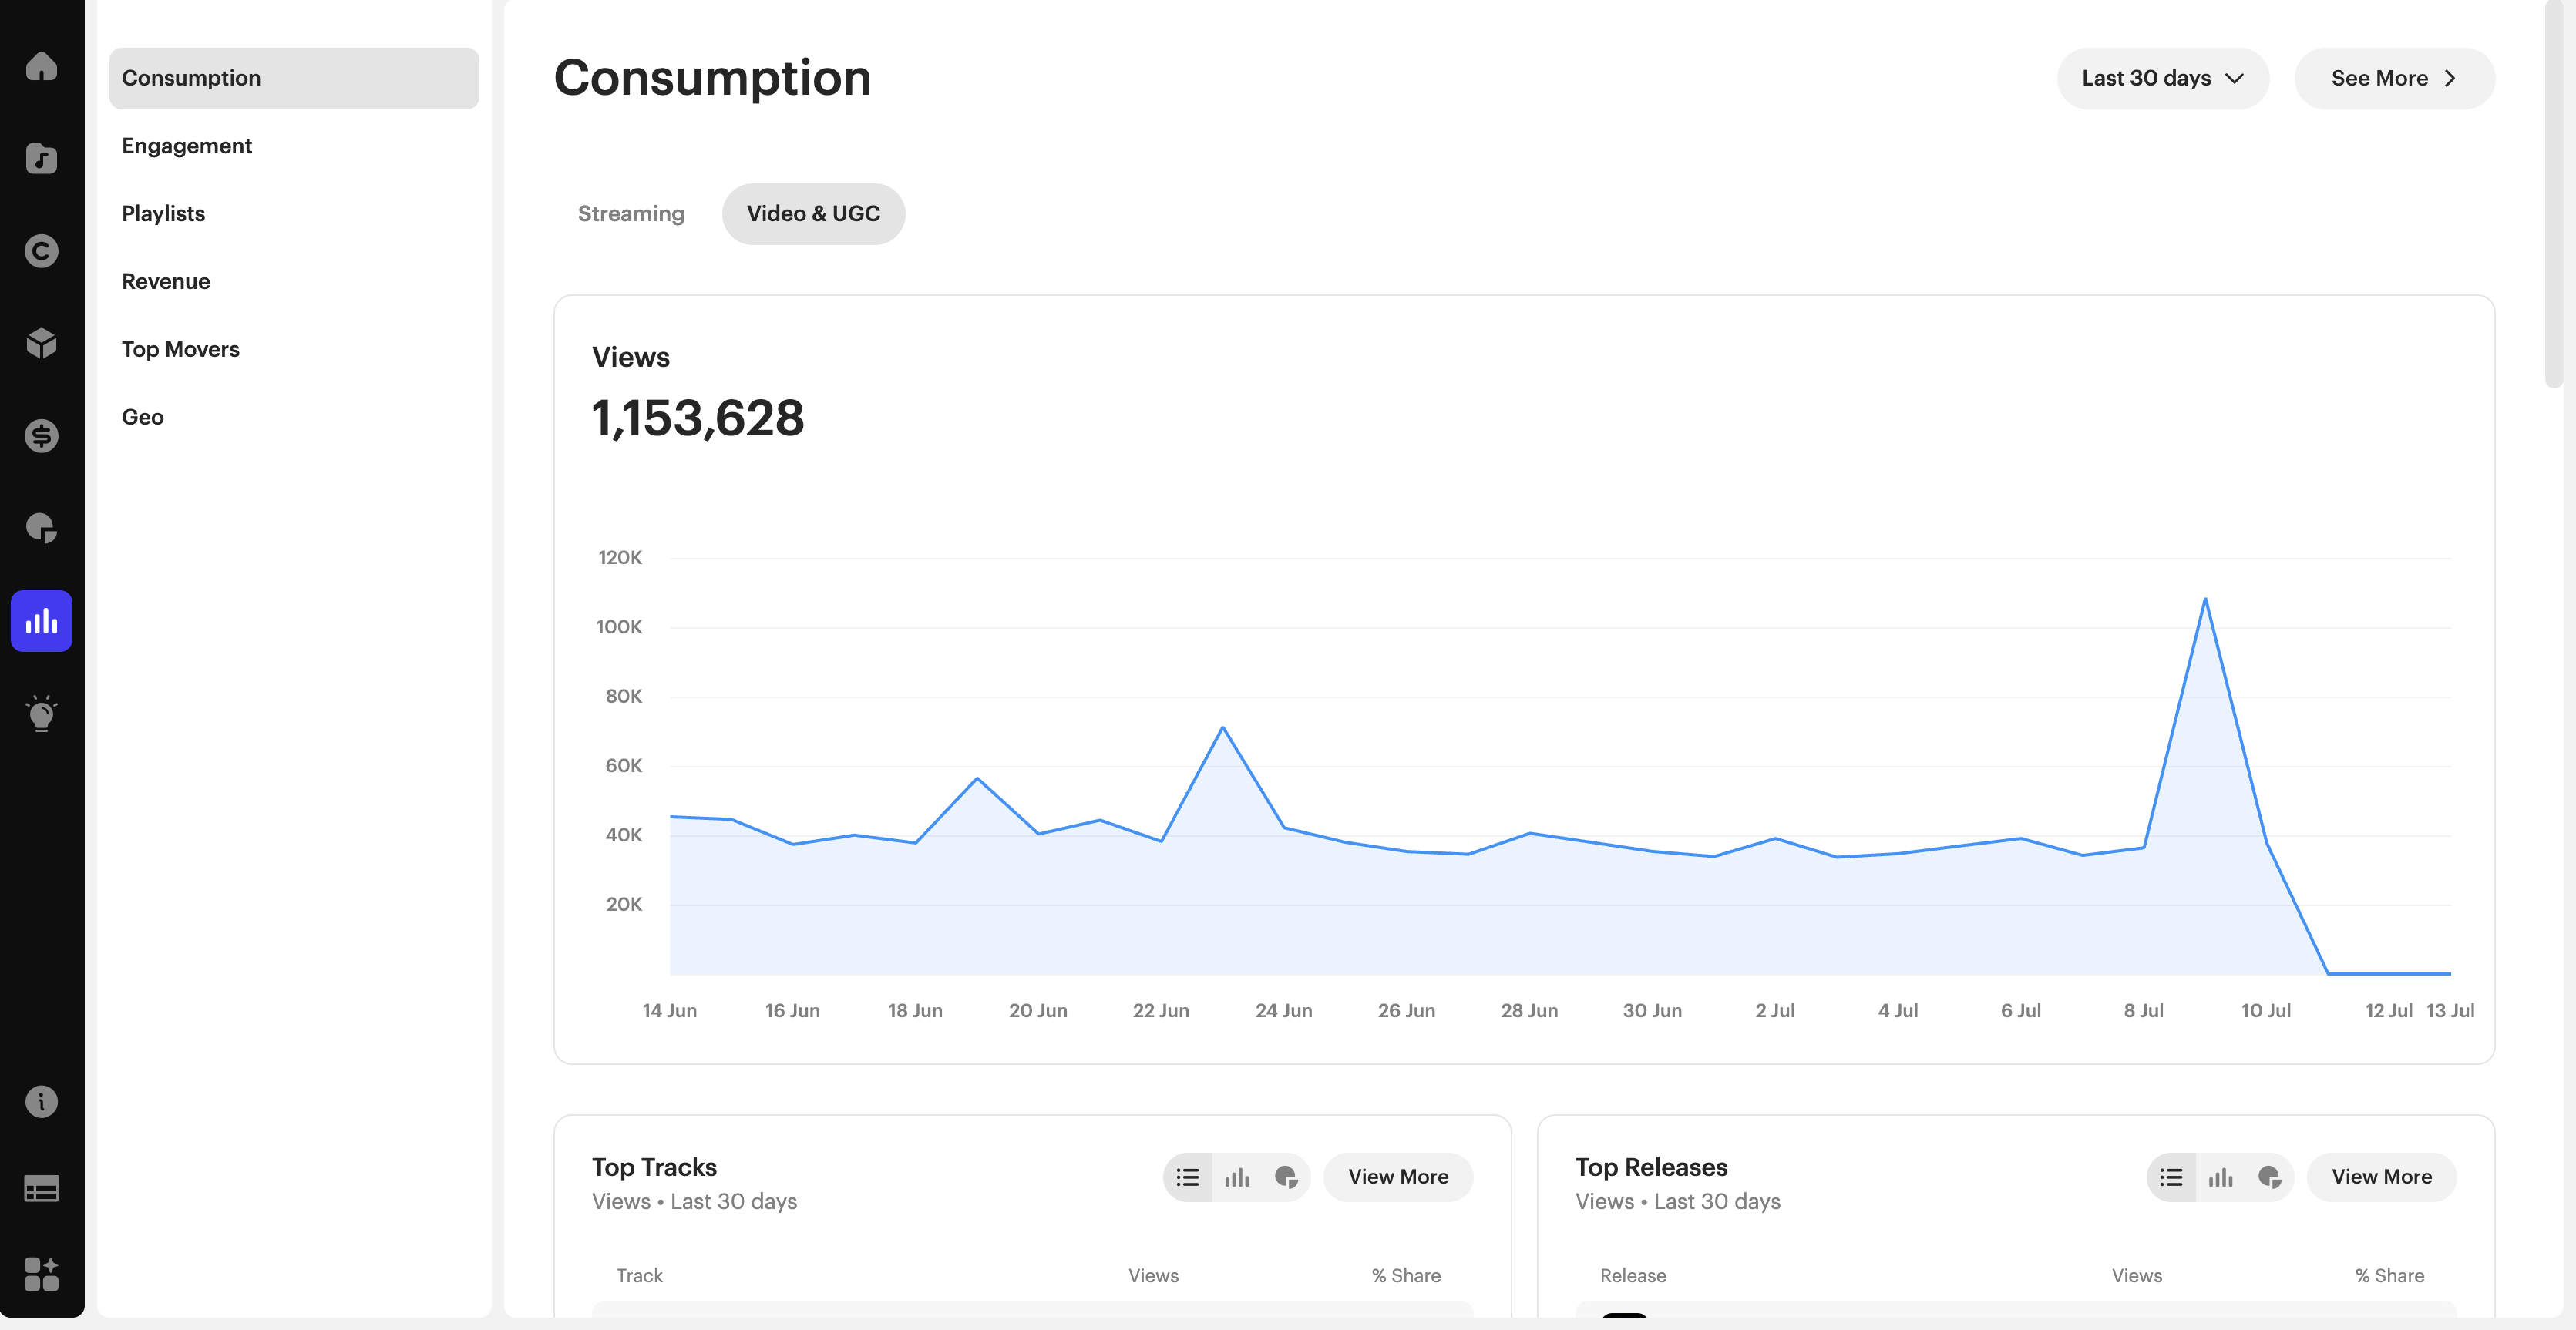
- A daily trend chart shows performance over time.
- Top Tracks and Top Releases tables show stream counts and percentage share.
- The date range selector defaults to Last 30 days, with up to 365 days of history available.
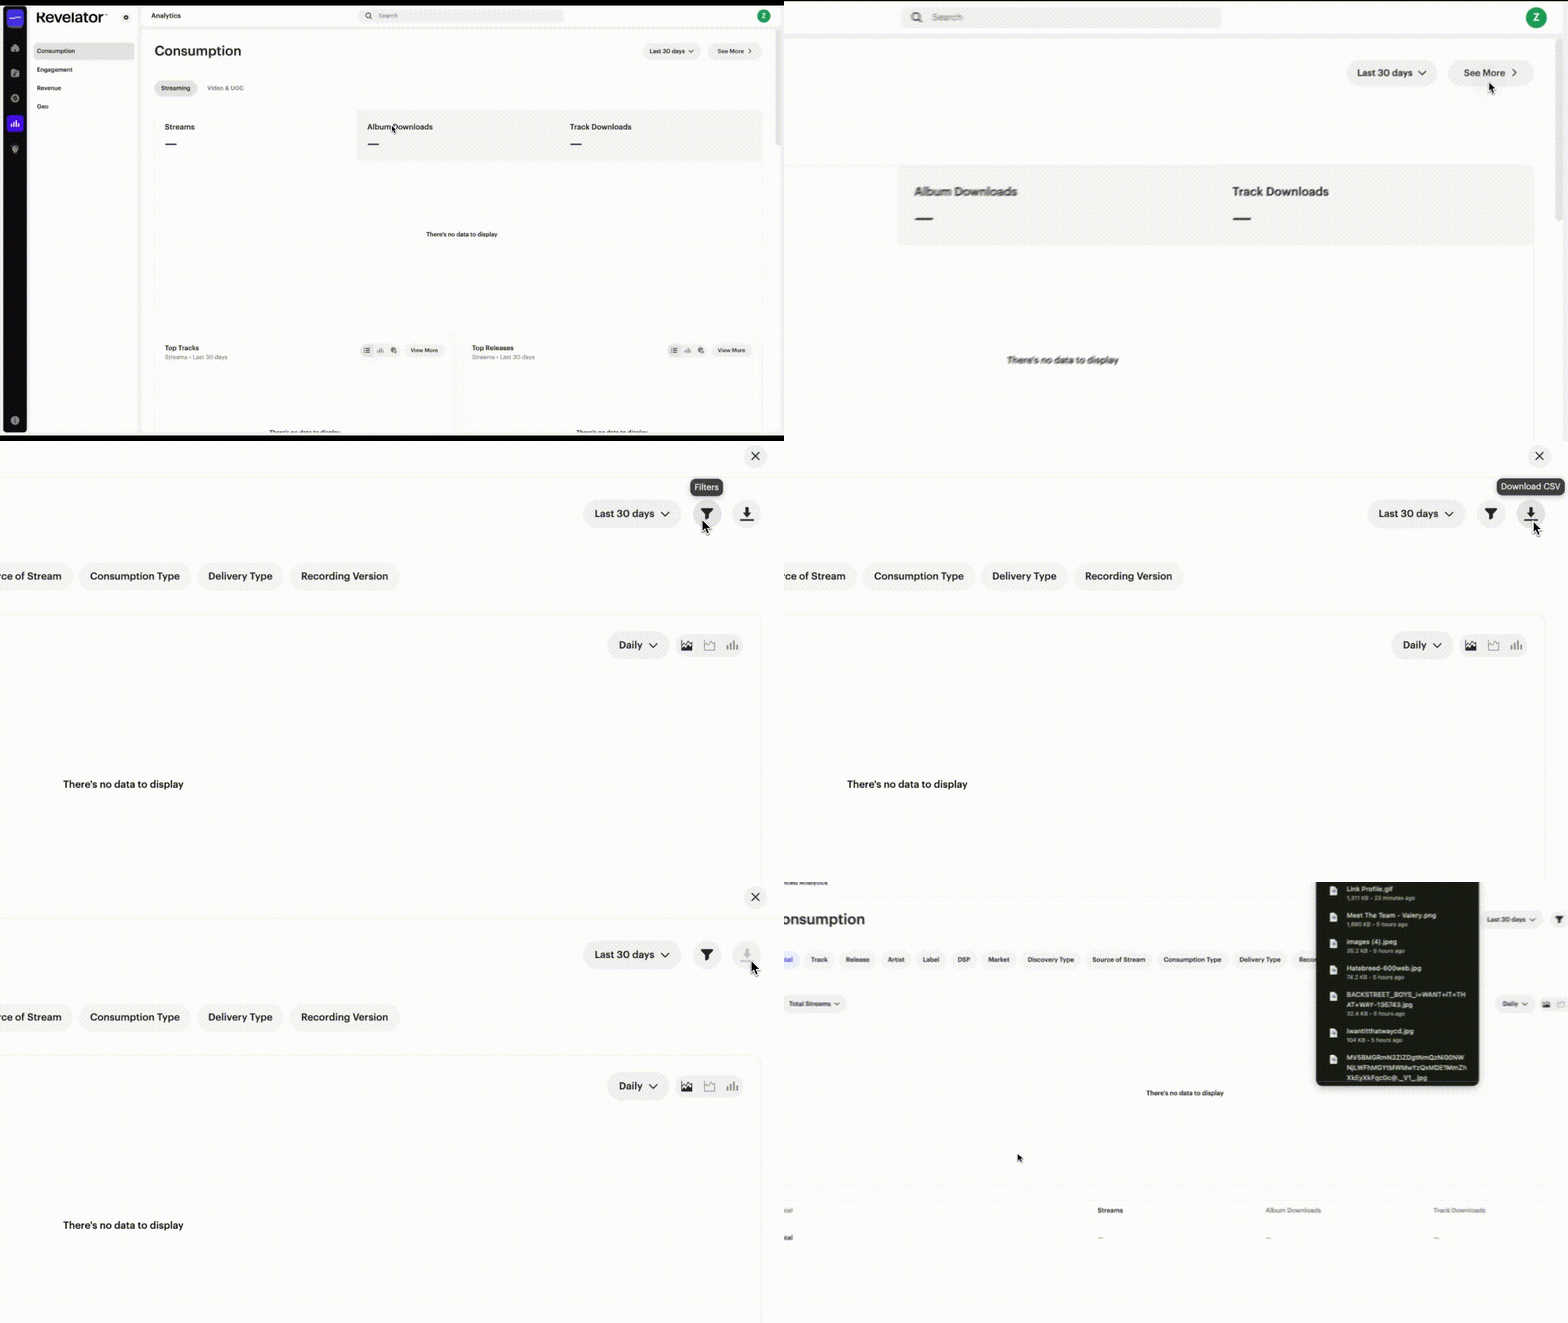
- Click See More to expand any section.
Breaking down your data
You can break down consumption data by track, release, artist, label, DSP, market, discovery type, and source of stream and recording version
Exporting your data
Click See More to open the advanced view, then use Download CSV to export your data.
Related articles
Was this article helpful?
That’s Great!
Thank you for your feedback
Sorry! We couldn't be helpful
Thank you for your feedback
Feedback sent
We appreciate your effort and will try to fix the article