Understanding performance is important. Understanding movement is critical.
Top Movers highlights where change is happening across your catalog. It shows which tracks, releases, artists, labels, DSPs, and markets are rising or falling based on streams or revenue, helping you quickly see what shifted and where to focus.
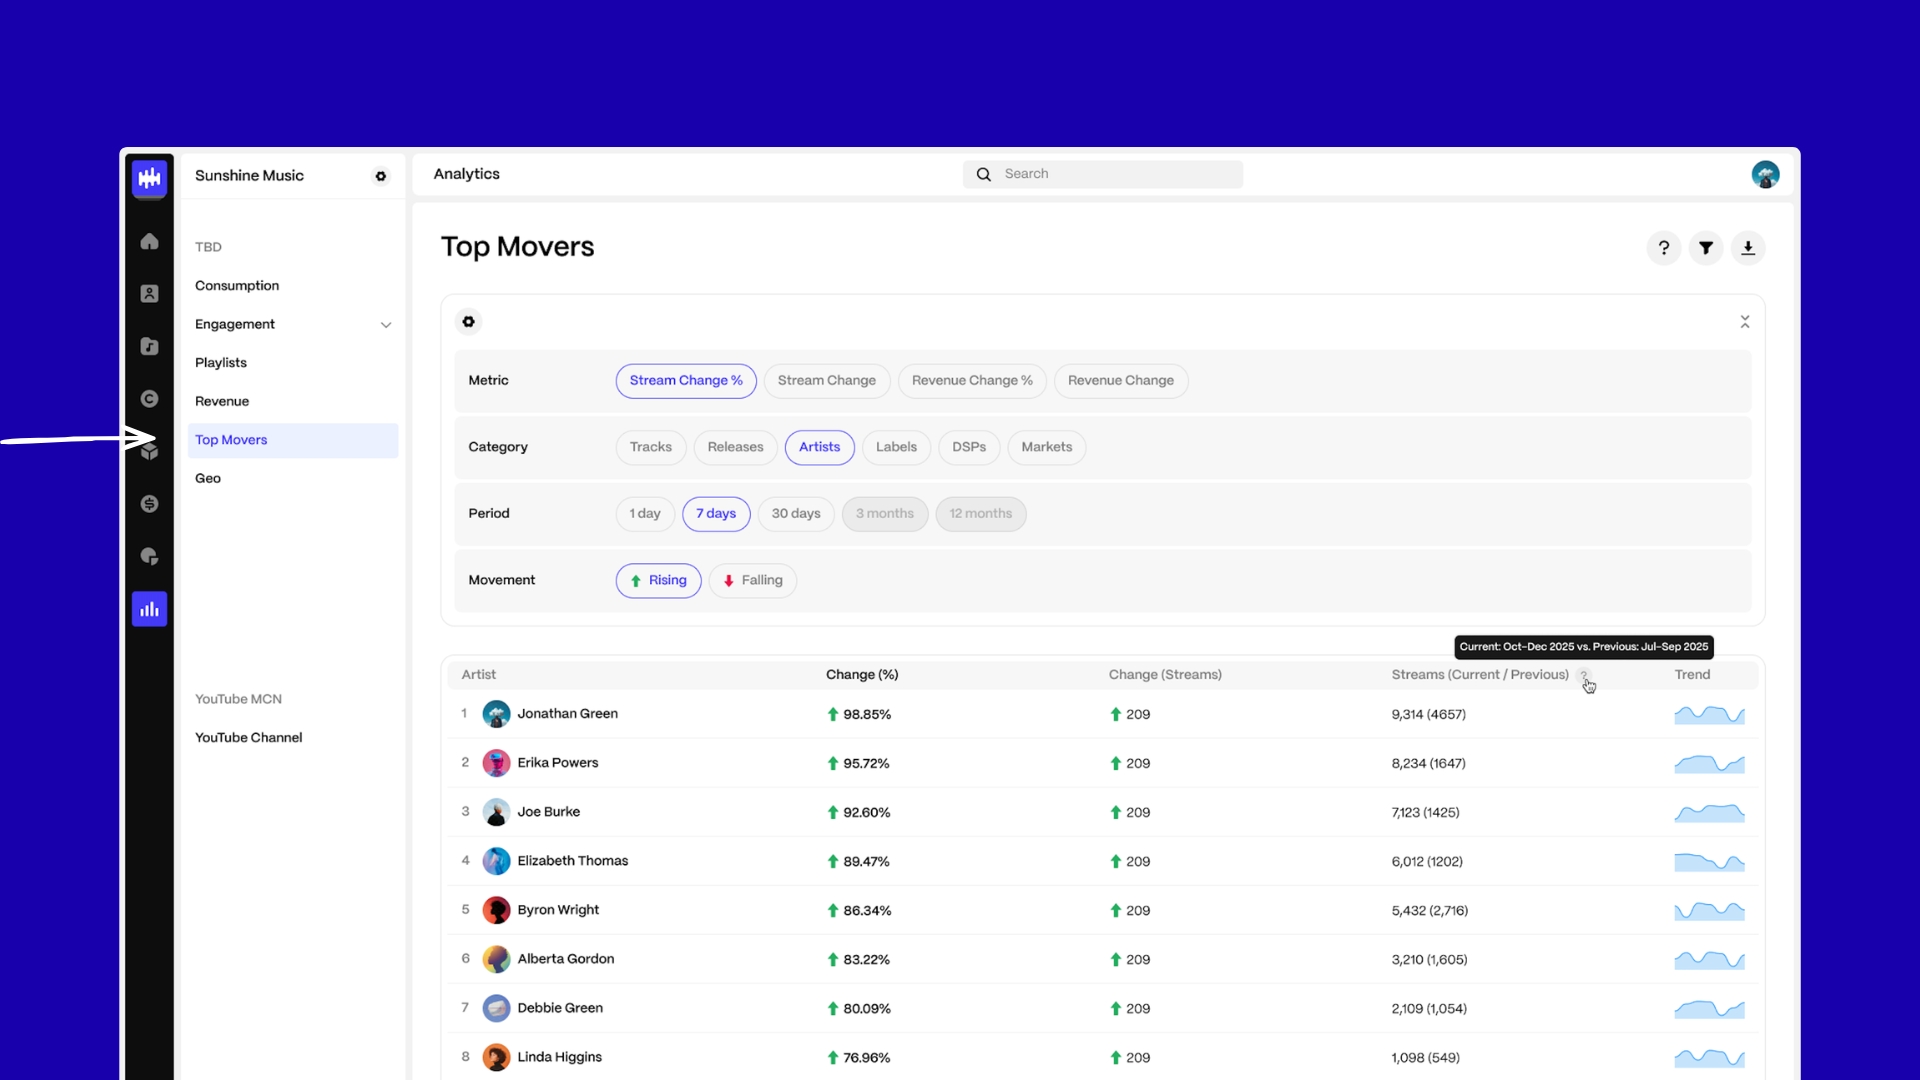
Where to find Top Movers
You can access Top Movers by navigating to:
Analytics → Top Movers
| Note Top Movers is available to standalone and parent enterprise accounts. Child accounts and portals do not have access. |
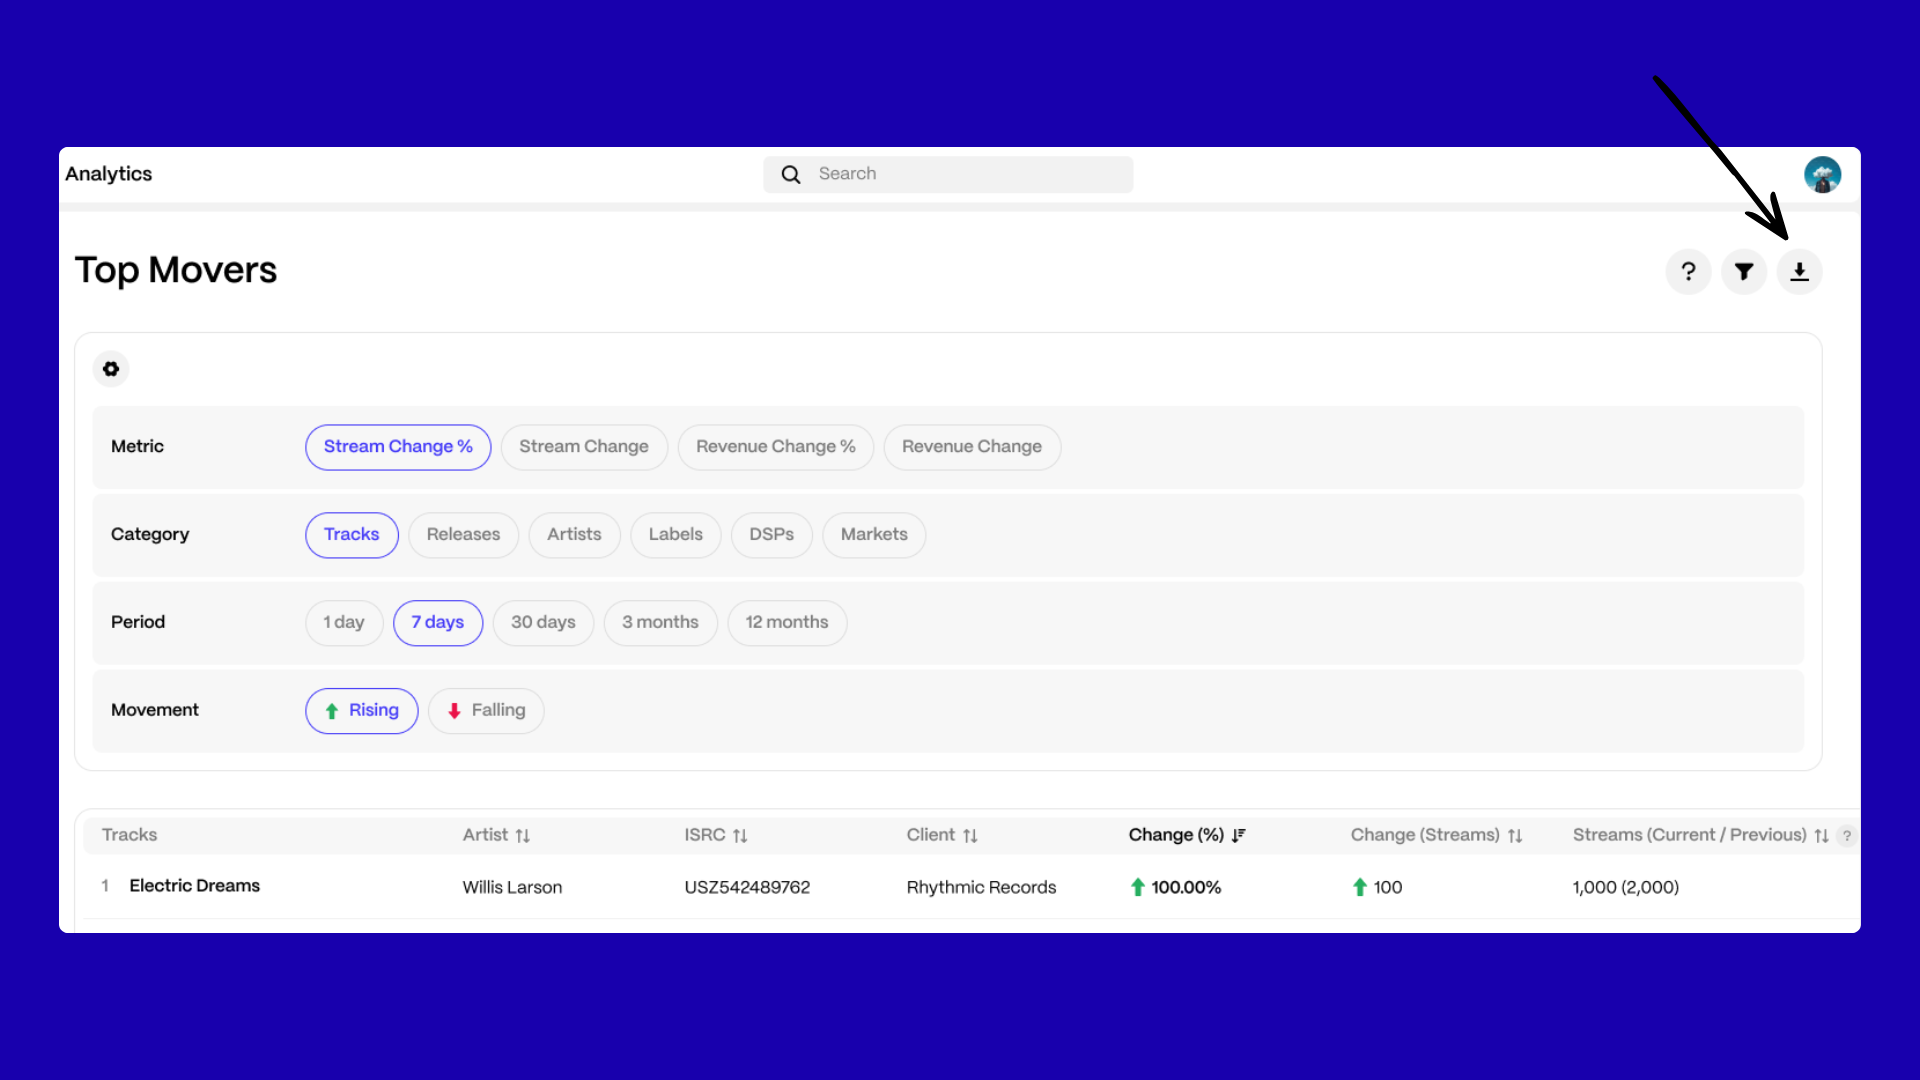
How Top Movers works
Top Movers is built around four selections at the top of the page: Metric, Category, Period, and Movement.
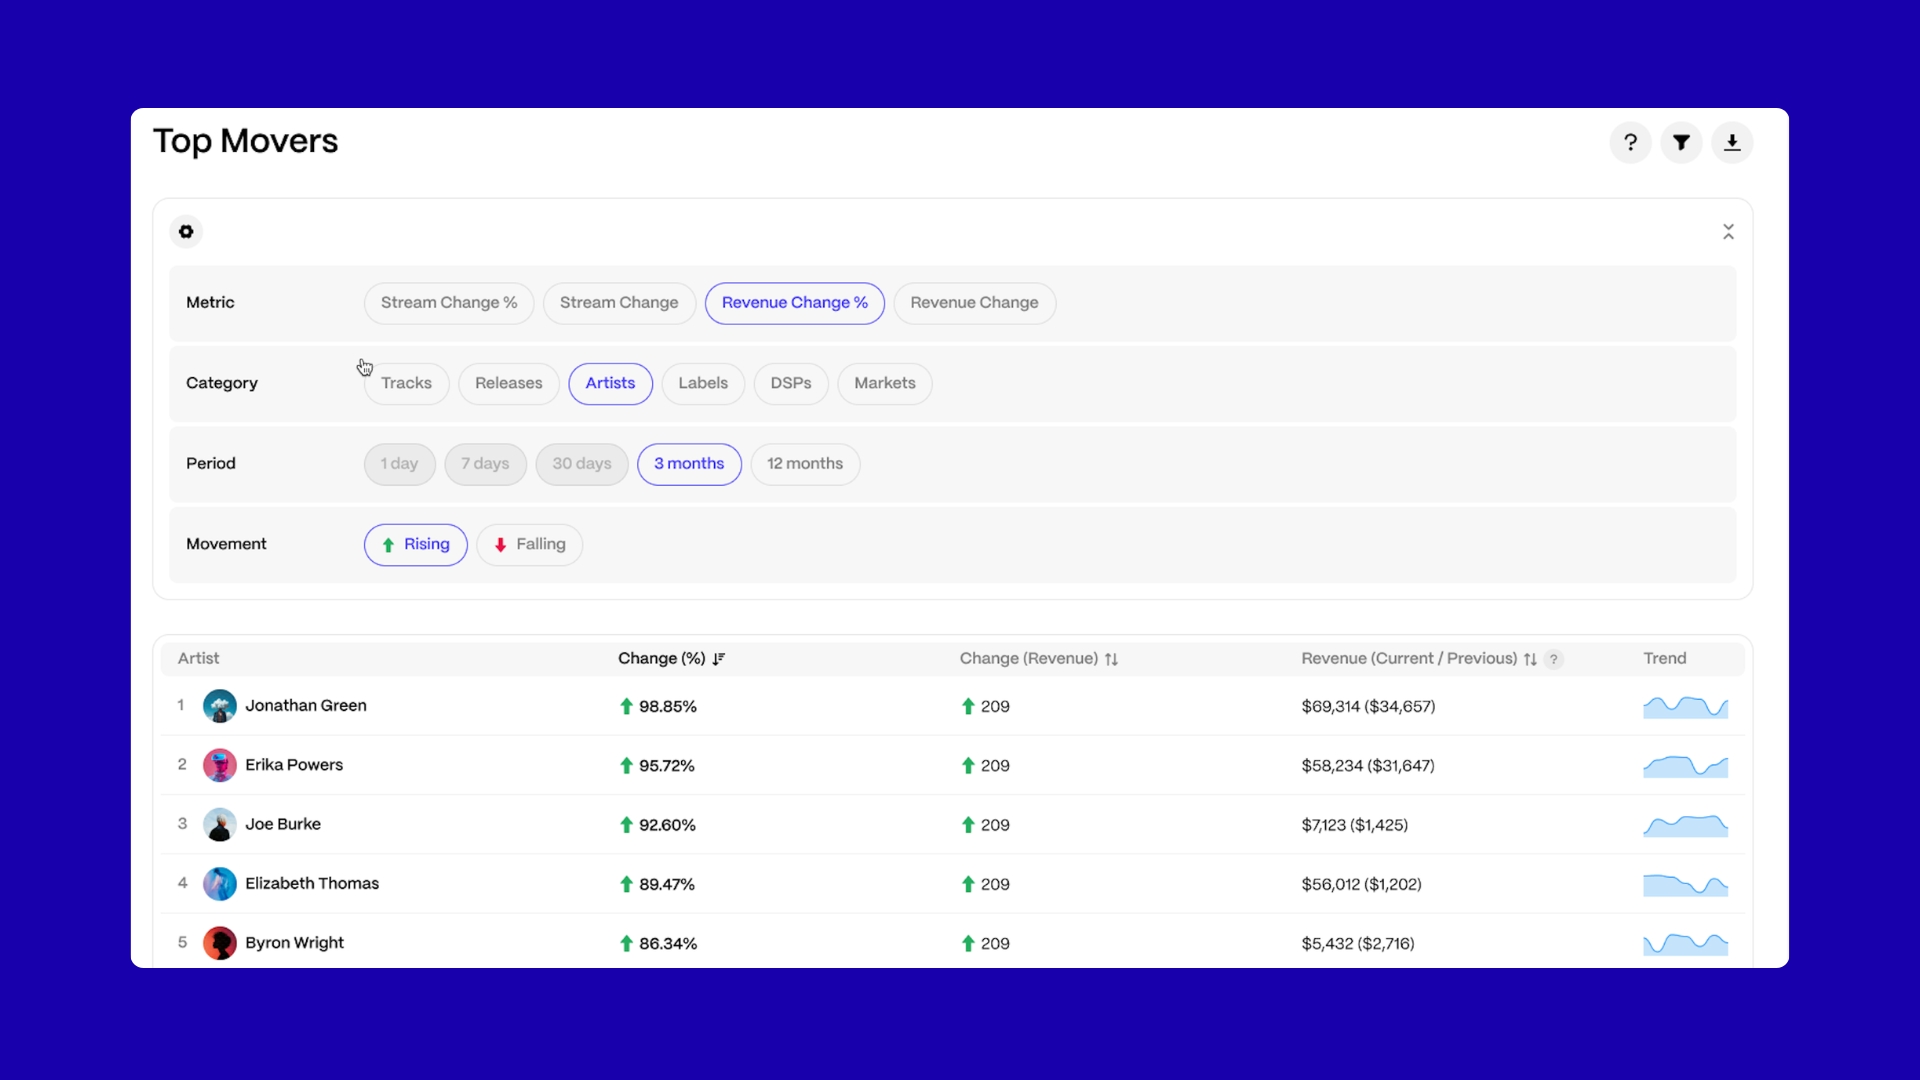
You choose whether to analyse stream or revenue change, select what you want to measure (such as tracks, artists, or markets), define the time period, and decide whether to view Rising or Falling results.
Each period compares performance against the previous equivalent period. For example, selecting 7 Days compares the last seven days against the seven days before.
When you adjust any of these selections, click Apply Changes to load updated results.
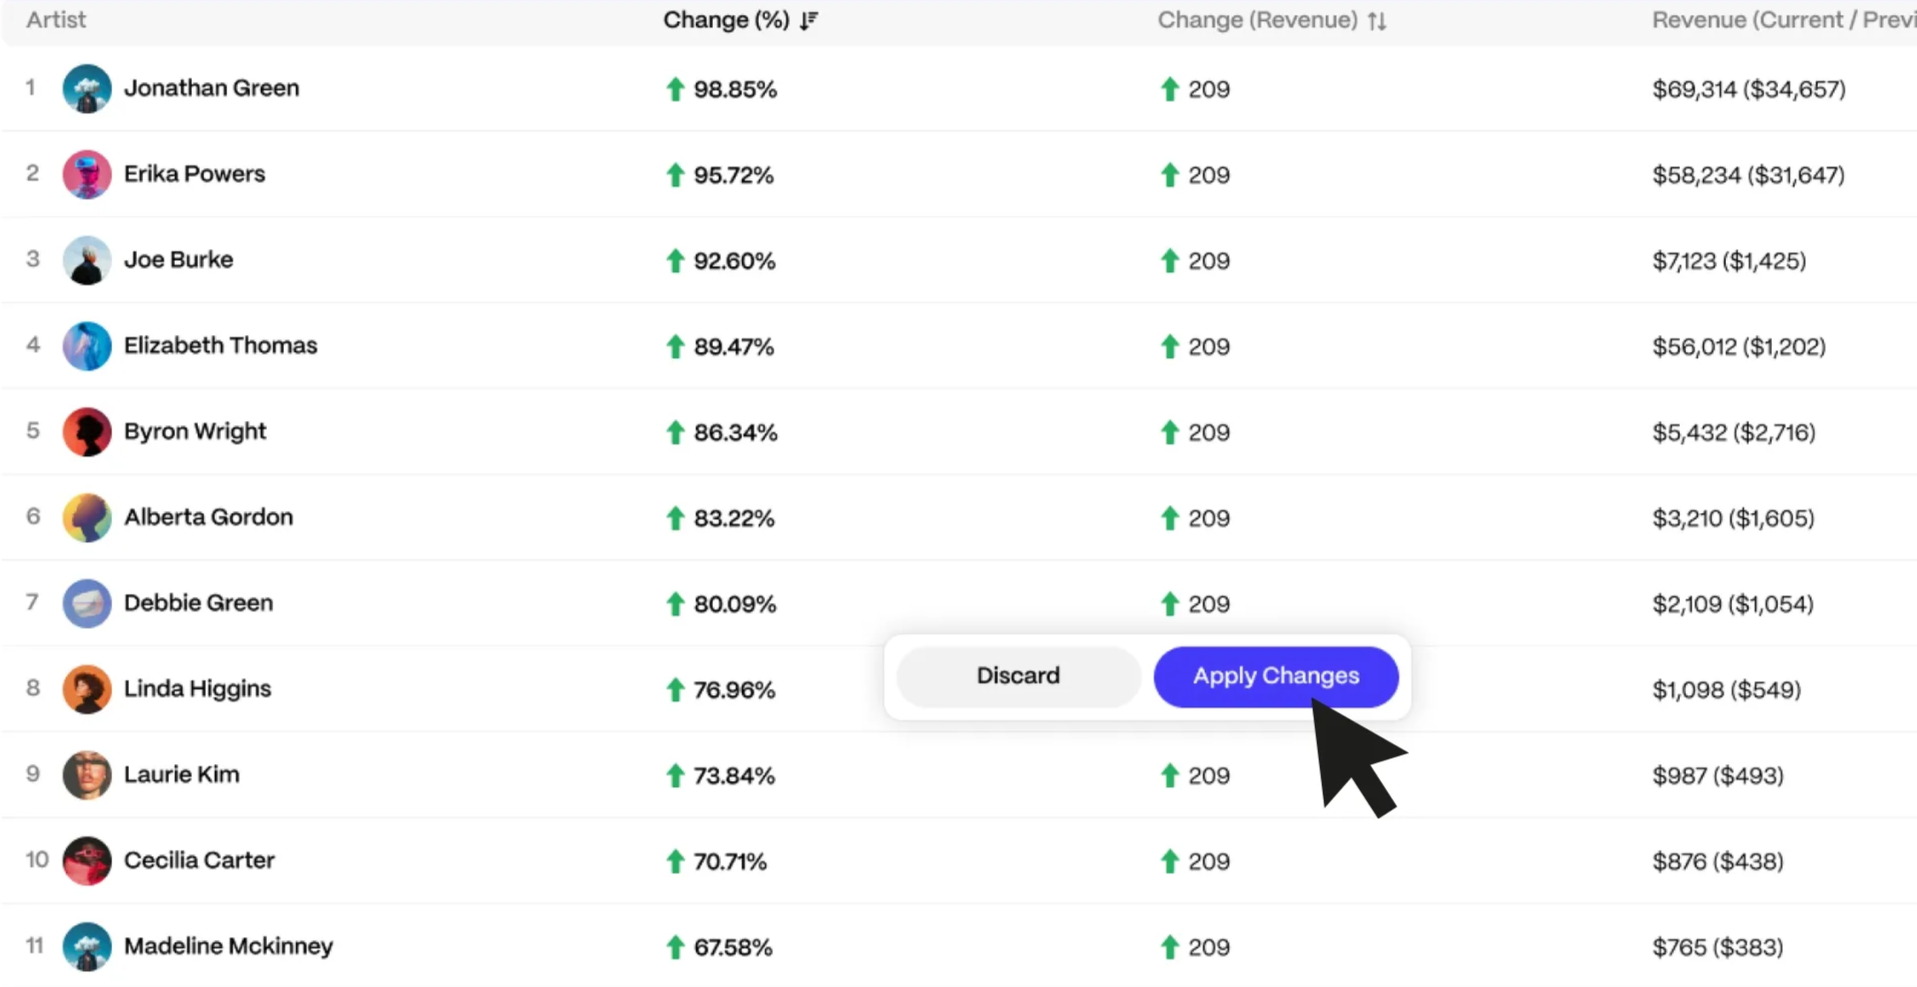
If you select Discard, the page will return to your previous configuration. Results are automatically ranked based on the selected metric, and manual sorting is not supported.
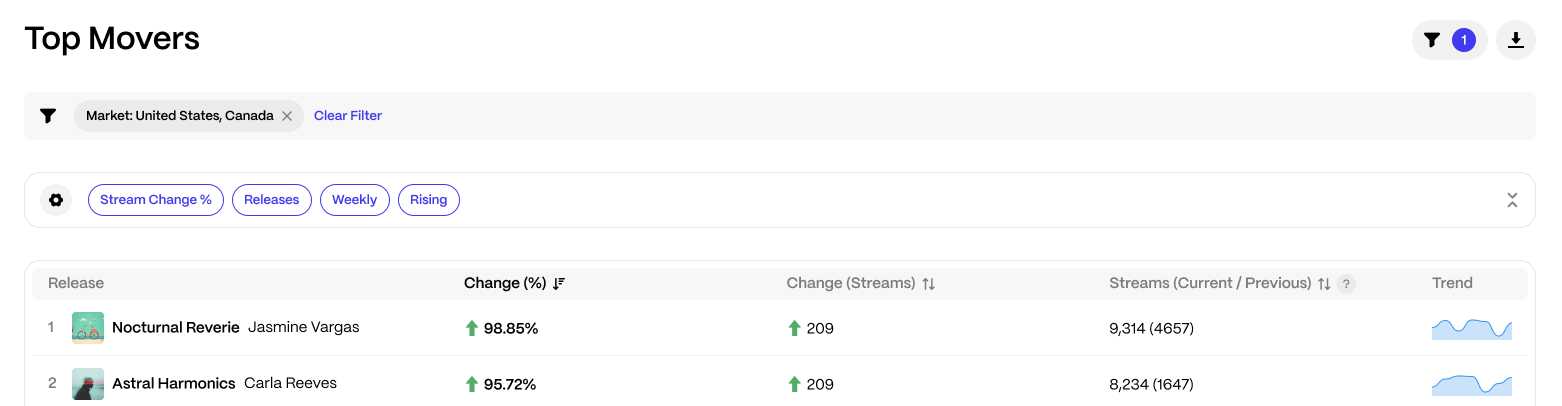
Reading the results table
The results table displays ranked entities based on your selected criteria.
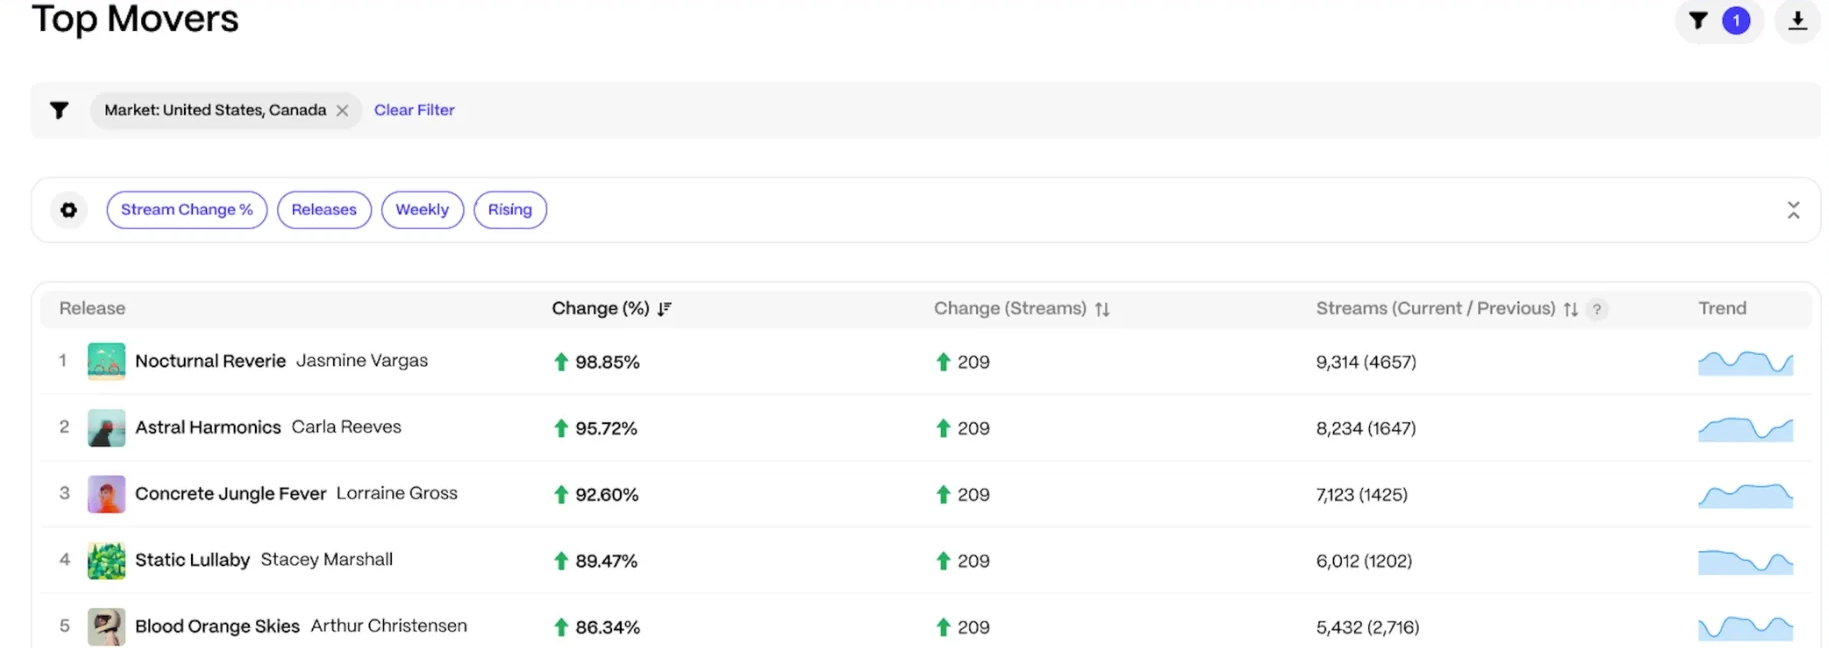
Each row shows the entity name, percentage change, absolute change, current and previous totals, and a trend sparkline. The sparkline provides additional context by showing a broader time range than the selected comparison period.
By default, the first 25 results are displayed. You can click Show More to expand the list up to 100 ranked results.
Using filters and drill-through
Filters allow you to narrow results by DSP, market, label, artist, release, or track.
This helps you isolate what is driving movement across your catalog. Clicking on any entity in the table opens the corresponding Analytics view, pre-filtered to the selected period, so you can investigate performance in more detail.
Exporting results
You can download the ranked results by clicking Download.
The exported CSV file reflects your current selections and filters and includes up to 100 ranked results.
Access and plan availability
Top Movers is available to parent enterprise accounts. Child accounts and artist, or payee portals, do not have access.
Certain comparison periods may depend on your subscription tier. If a time range is unavailable, an upgrade option will be displayed within the page.
FAQ
Why don't I see certain time periods?
Some comparison ranges depend on your subscription plan.
Why are some assets missing?
Minimum performance thresholds may exclude low-activity results.
Can I sort the table manually?
No. Results are automatically ranked based on the selected metric.
How often is data updated?
Streaming and revenue data refresh according to DSP reporting schedules.
Was this article helpful?
That’s Great!
Thank you for your feedback
Sorry! We couldn't be helpful
Thank you for your feedback
Feedback sent
We appreciate your effort and will try to fix the article